Fancy ServiceNow Reports

Been a while since I posted something on here, so here is something a little different to the usual mental-health related melodrama I post.
For the few years, I have been working on ServiceNow in my job, and one of the things that has constantly frustrated me is the lack of tools to make fancy reports.
Of course, you can export records to a flat Excel document, but if you want to make it look pretty, say for distributing to customers, you then have to process it outside of the tool. This is not only time consuming, but can lead to inconsistent results.
I stumbled across a post on the community forums that mentioned using the ExcelJS library to create custom spreadsheet. It's a great library - and this alone could have solved my issue, but me being me....
Taking it one step further
One use case I could see for this immediately was to speed up a report that is currently a manual process consisting of:
- Export Data from ServiceNow tables and combine into a single CSV file locally
- Open an Excel spreadsheet that has macro functions built into it to format it nicely
- Sit back and wait while the macro does it's thing (sometimes crashing)
It works, but it's not efficient. Wouldn't it be great if I could just press a button on ServiceNow and generate a report that require little to no post processing from the requesting user?
Using the UI page example from the above community post as a base, it turns out that we can indeed do something like this! After a bit of trial and error, I got there... so here it is if you like that sort of thing.
HTML
<?xml version="1.0" encoding="utf-8" ?>
<j:jelly trim="false" xmlns:j="jelly:core" xmlns:g="glide" xmlns:j2="null" xmlns:g2="null">
	<script src="https://unpkg.com/exceljs/dist/exceljs.min.js"></script>
	<input type="date" id="startDate" />
	<input type="date" id="endDate" />
	<button onclick="generateExcel()">Generate Excel</button>
</j:jelly>
Client Script
function generateExcel() {
var startDate = jQuery("#startDate").val();
var endDate = jQuery("#endDate").val();
var ga = new GlideAjax("global.my_first_script_include");
ga.addParam("sysparm_name", "getData");
ga.addParam("sysparm_startDate", startDate);
ga.addParam("sysparm_endDate", endDate);
ga.getXMLAnswer(processData);
function processData(data) {
var jsonData = JSON.parse(data);
var ga = new GlideAjax("global.my_first_script_include");
ga.addParam("sysparm_name", "getTemplateSysId");
ga.getXMLWait();
var templateSysId = ga.getAnswer();
if (templateSysId.indexOf("Error") > -1) {
alert(templateSysId);
return;
}
var templateUrl = "/sys_attachment.do?sys_id=" + templateSysId;
var request = new XMLHttpRequest();
request.open("GET", templateUrl, true);
request.responseType = "blob";
request.onload = function () {
var reader = new FileReader();
reader.readAsArrayBuffer(request.response);
reader.onload = function (event) {
var arrayBuffer = event.target.result;
var workbook = new ExcelJS.Workbook();
workbook.xlsx.load(arrayBuffer).then(function () {
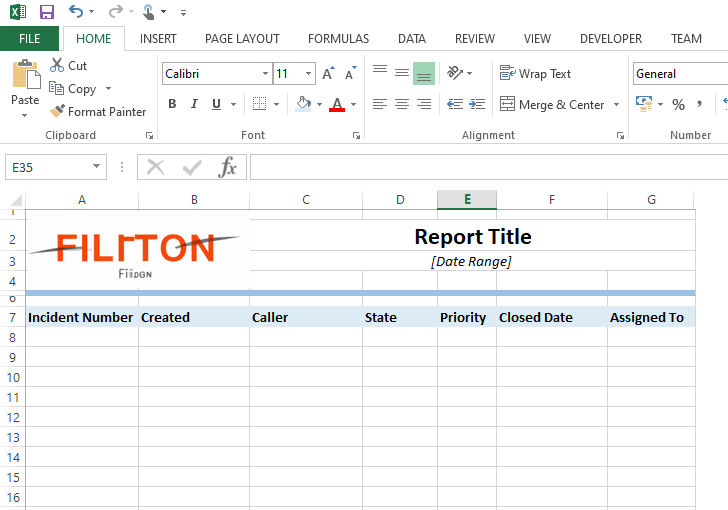
var worksheet = workbook.worksheets[0];
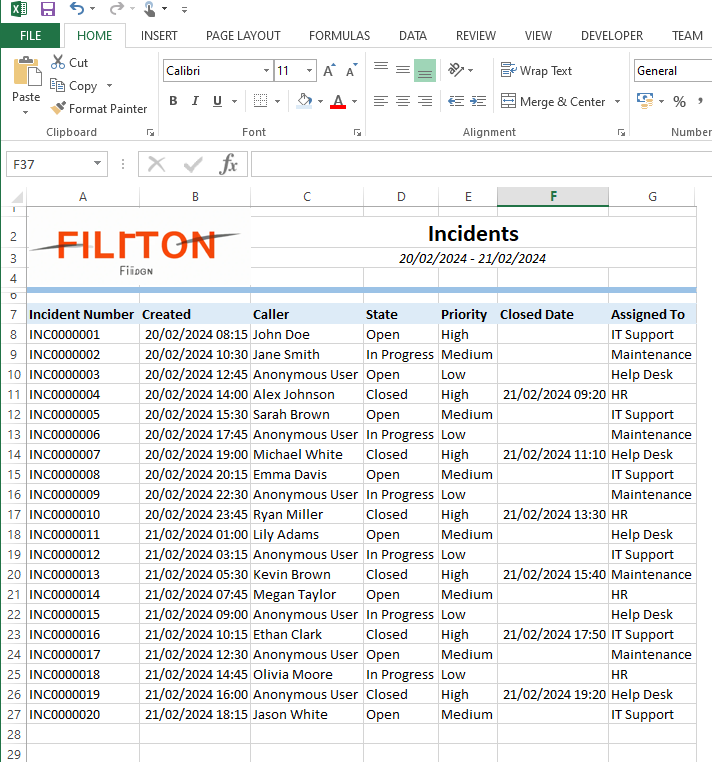
worksheet.getCell("C2").value = "Incidents";
worksheet.getCell("C3").value = startDate + " - " + endDate;
jsonData.forEach(function (row) {
worksheet.addRow([
row.incident,
row.opened,
row.caller,
row.state,
row.priority,
row.resolved,
row.assigned_to
]);
});
workbook.xlsx.writeBuffer().then(function (buffer) {
var blob = new Blob([buffer], {
type: "application/vnd.openxmlformats-officedocument.spreadsheetml.sheet",
});
var url = URL.createObjectURL(blob);
var link = document.createElement("a");
link.href = url;
link.download =
"My First Report.xlsx";
link.click();
});
});
};
};
request.send();
}
}Script include
var my_first_script_include = Class.create();
my_first_script_include.prototype = Object.extendsObject(AbstractAjaxProcessor, {

	// Get the sysID of the template excel file attached to a specific UI page
	getTemplateSysId: function () {
		var template = new GlideRecord("sys_attachment");
		template.addEncodedQuery(
			"file_name=Template.xlsx^table_name=sys_ui_page^table_sys_id=a7fb28a847a04a501413e533036d43e8"
		);
		template.query();
		if (template.next() && template.getRowCount() == 1) {
			return template.sys_id.toString();
		} else {
			return "Error! Cannot find the report template file, please contact system administrator.";
		}
	},

	// Get the data to insert into the excel file
	getData: function () {
		var startDate = this.getParameter("sysparm_startDate").toString();
		var endDate = this.getParameter("sysparm_endDate").toString();

		var jsonData = [];

		var gr = new GlideRecord('incident');
		gr.addQuery('opened_at', '>=', startDate + " 00:00:00");
		gr.addQuery('opened_at', '>=', endDate + " 23:59:59");
		gr.query();
		while (gr.next()) {
			jsonData.push({
				incident: gr.getDisplayValue("number"),
				opened: gr.getDisplayValue("opened_at"),
				caller: gr.getDisplayValue("caller_id"),
				state: gr.getDisplayValue("state"),
				priority: gr.getDisplayValue("priority"),
				resolved: gr.getDisplayValue("resolved_at"),
				assigned_to: gr.getDisplayValue("assigned_to")
			});
		}
		return JSON.stringify(jsonData);

	},

	type: 'my_first_script_include'
});
Update Set
Here's an update set and a basic template. I'm sure there is room for improvement, if you have any suggestions, feel free to reach out.